Python in Excel is a function you type into a cell, if your Microsoft 365 plan includes it. The useful question is not whether Python beats formulas but which of the calculations you already do get shorter, clearer or easier to check in Python, and which do not. This tutorial runs five of them both ways on one fictitious sales table and compares the results cell by cell.
What Python in Excel is
You write Python in a cell with the PY function (Formulas, Insert Python, or type =PY and pick it from the list). Excel sends the code and the data it references to Microsoft's cloud, runs it there, and returns the result to the sheet. You do not install Python. The environment already includes pandas, NumPy, Matplotlib, seaborn and statsmodels, and other libraries from the Anaconda distribution can be imported.
The function that brings your data in is xl(). It reads a cell, a range, a named range, a table or a Power Query connection:
df = xl("tblSales[#All]", headers=True)
That line turns the Sales table into a pandas DataFrame called df. The second argument of PY chooses the result: Excel value spills it into cells; Python object keeps it as an object that another PY cell can use.
Who can use it today
Availability changes, so check Microsoft's own page, "Python in Excel availability", before you promise it to a client. When I read it in October 2026, it said this:
| Where | Status |
|---|---|
| Excel for Microsoft 365 on Windows, Business and Enterprise | Available (Current Channel from version 2408) |
| Excel for Microsoft 365 for Mac, Business and Enterprise | Available (Current Channel from version 16.96) |
| Excel for the web, Business and Enterprise | Available |
| Family, Personal and Education plans | Preview only |
| Excel for iPad, iPhone and Android | Not available: you can open the file, but Python cells show an error when they recalculate |
| Excel 2021, 2024 and other perpetual licenses | Not supported: it needs a paid Microsoft 365 license that includes the desktop apps |
It also needs internet access, because the code runs in the cloud. Standard compute is included; a monthly allowance of faster premium compute is included too, and once it is used the calculations drop back to standard speed. Microsoft sells an add-on for more premium compute.
The data and the rule of the test
The workbook has a Sales table of 48 fictitious sales from January to June 2026, in three regions and two products. Two sales are large on purpose, S-118 and S-139, so there is something to find. Each calculation below has an Excel formula and a Python version, and the workbook compares them. The expected Python values come from pandas run outside Excel on the same table; you paste your own PY result next to them.
1. Total by region
=SUMIFS(tblSales[Amount], tblSales[Region], "North")
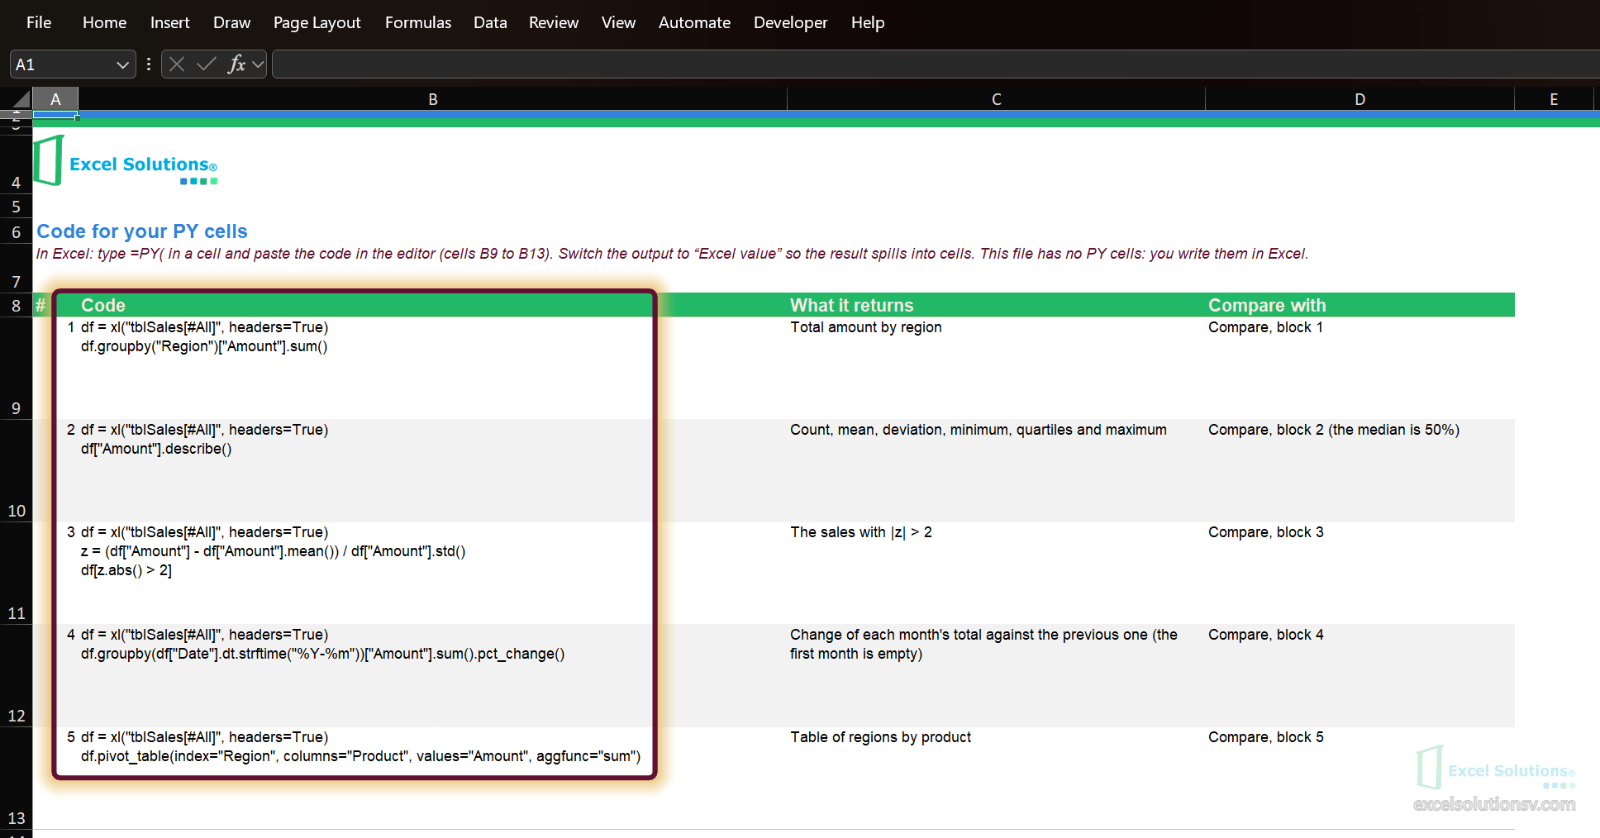
df = xl("tblSales[#All]", headers=True)
df.groupby("Region")["Amount"].sum()
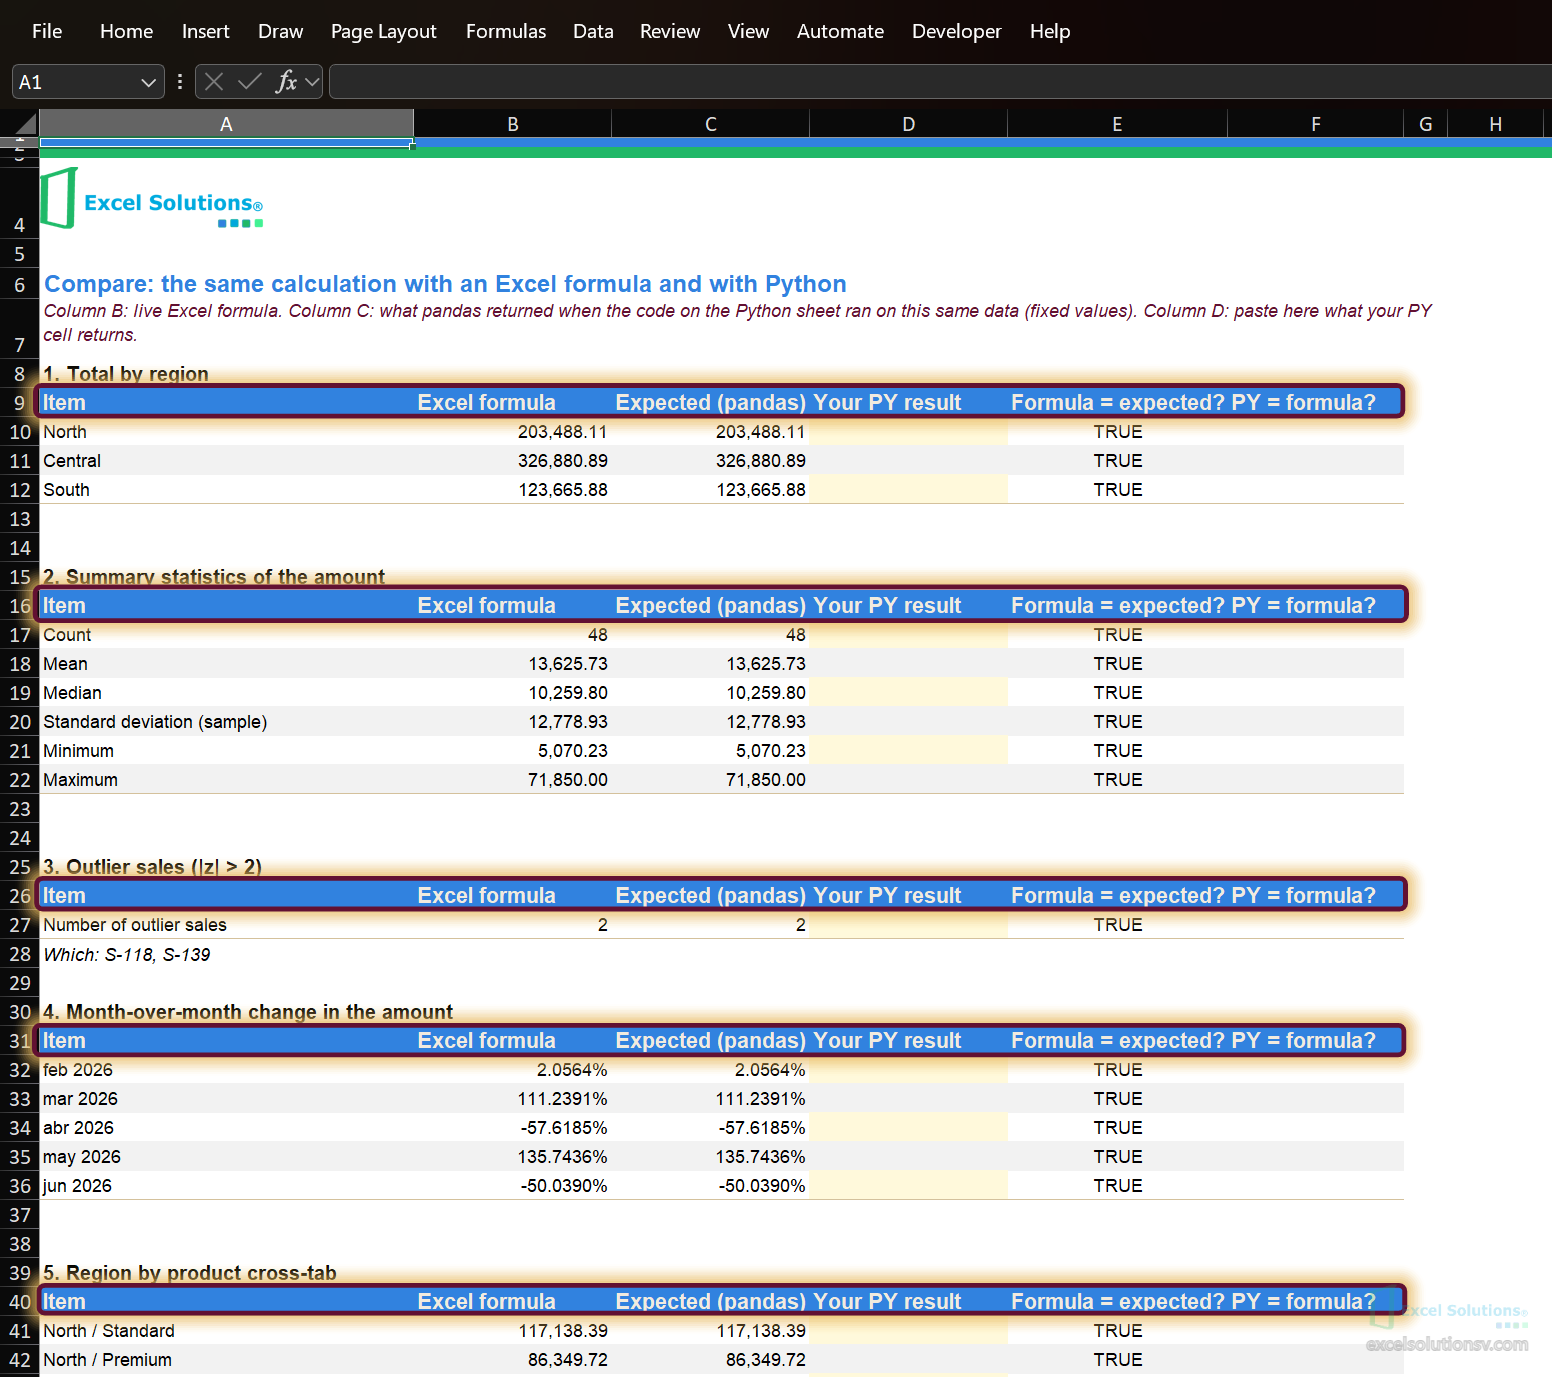
Both give North 203,488.11, Central 326,880.89 and South 123,665.88. The formula is shorter, runs in any version of Excel and does not need the cloud. For this calculation I would not use Python.
2. Summary statistics
=COUNT(tblSales[Amount])
=AVERAGE(tblSales[Amount])
=MEDIAN(tblSales[Amount])
=STDEV.S(tblSales[Amount])
=MIN(tblSales[Amount])
=MAX(tblSales[Amount])
df = xl("tblSales[#All]", headers=True)
df["Amount"].describe()
Six formulas against one line. Both give a count of 48, a mean of 13,625.73, a median of 10,259.80, a standard deviation of 12,778.93, a minimum of 5,070.23 and a maximum of 71,850.00; the median appears in Python as the 50% row. The standard deviation matches because pandas divides by n minus 1, as STDEV.S does; STDEV.P would not match. Python also adds the quartiles, and it gets better with many columns: describe() on a whole table gives this summary for every numeric column at once.
3. Finding outliers
A z-score measures how many standard deviations a value is from the mean. Flag the sales with an absolute z-score above 2:
=SUMPRODUCT(--(ABS((tblSales[Amount]-AVERAGE(tblSales[Amount]))/STDEV.S(tblSales[Amount]))>2))
df = xl("tblSales[#All]", headers=True)
z = (df["Amount"] - df["Amount"].mean()) / df["Amount"].std()
df[z.abs() > 2]
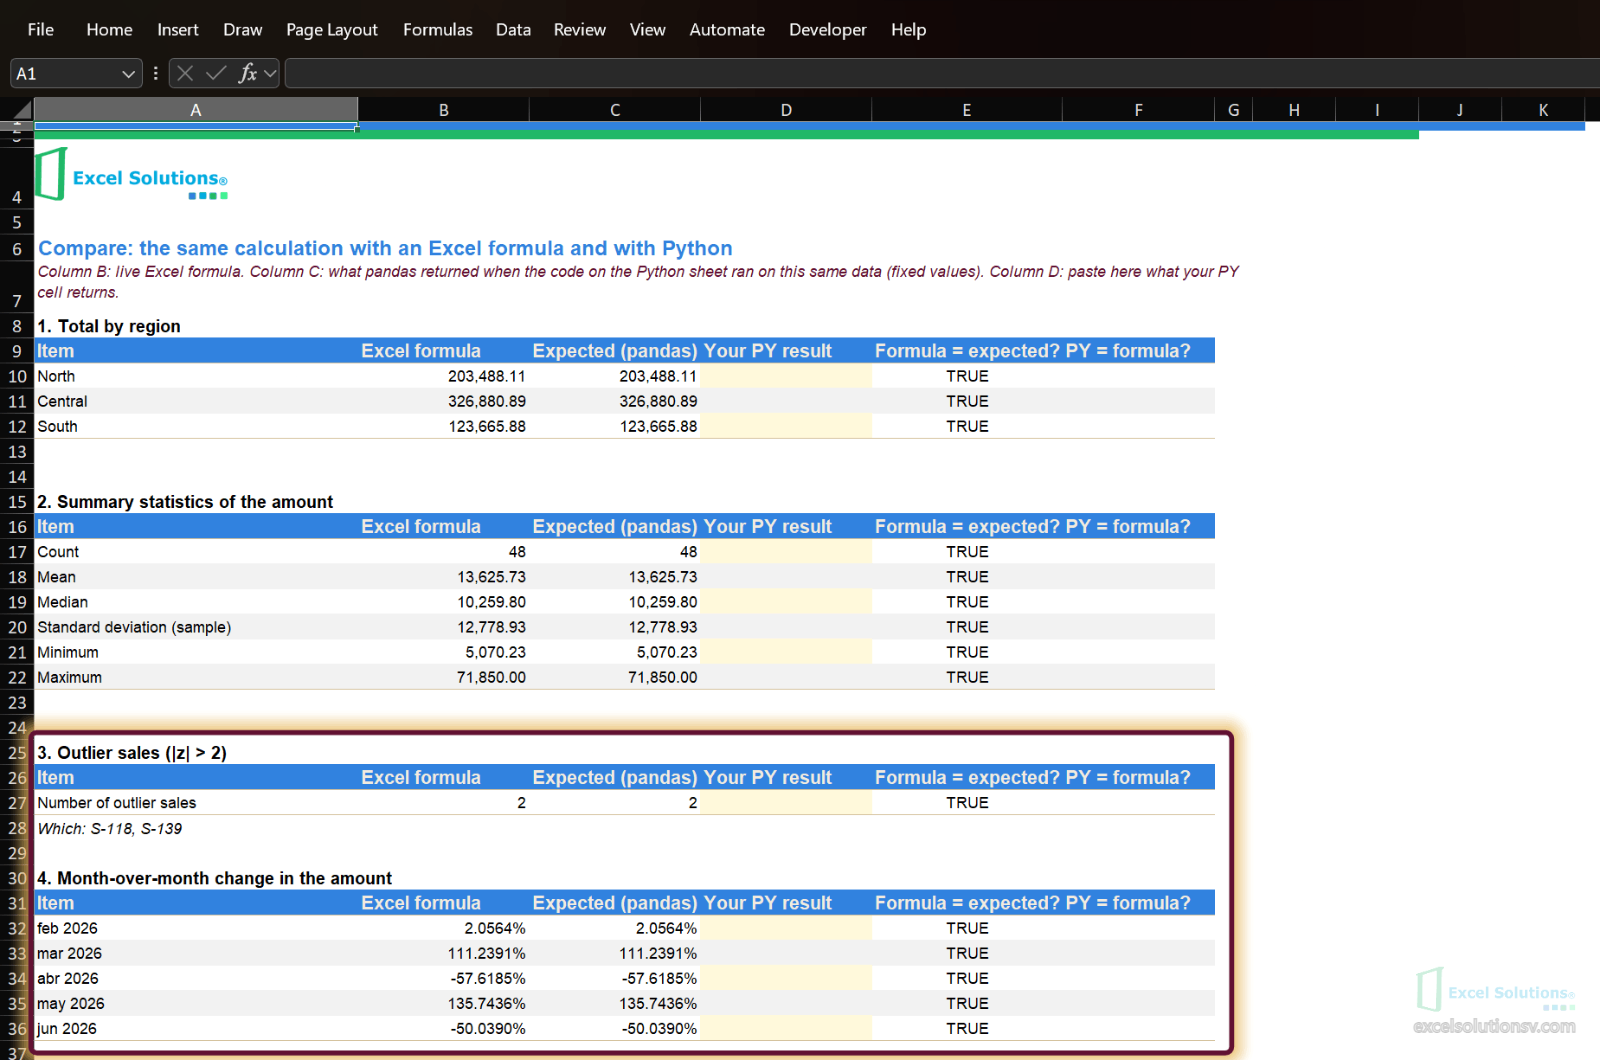
The formula counts them: 2. The Python code returns the two rows, S-118 and S-139. Python is clearer here because you name the z-score once and filter with it; the formula repeats the same expression inside SUMPRODUCT.
4. Month-over-month change
=SUMIFS(tblSales[Amount], tblSales[Date], ">="&A32, tblSales[Date], "<"&EDATE(A32,1)) / SUMIFS(tblSales[Amount], tblSales[Date], ">="&EDATE(A32,-1), tblSales[Date], "<"&A32) - 1
df = xl("tblSales[#All]", headers=True)
df.groupby(df["Date"].dt.strftime("%Y-%m"))["Amount"].sum().pct_change()
In the formula, A32 holds the first day of the month you are measuring. Both give February +2.06%, March +111.24%, April -57.62%, May +135.74% and June -50.04%. The big swings are the two outliers: S-118 falls in March and S-139 in May. The Python version is one chain; the formula needs the month's total twice, once for the month and once for the previous month.
5. Region by product
=SUMIFS(tblSales[Amount], tblSales[Region], "North", tblSales[Product], "Standard")
df = xl("tblSales[#All]", headers=True)
df.pivot_table(index="Region", columns="Product", values="Amount", aggfunc="sum")
| Region | Standard | Premium |
|---|---|---|
| North | 117,138.39 | 86,349.72 |
| Central | 125,229.55 | 201,651.34 |
| South | 78,350.99 | 45,314.89 |
The formula is one cell, and you write it six times, once per combination. The Python code gives the whole table in one step. An Excel PivotTable does the same without code, so Python is not the only alternative here.
When I use each one
| Situation | I use |
|---|---|
| A total or a lookup that a colleague must be able to recalculate on any device | Formula |
| A file that goes to someone with Excel 2021, 2024 or the mobile app | Formula |
| Summary statistics of many columns, outliers, a pivot with several aggregations | Python |
| A chart that Excel's own types do not cover, such as a seaborn heat map | Python (I did not test chart code in this workbook) |
| Data that must not leave the company's network | Check your company's policy first: the code runs in Microsoft's cloud |
On the data: Microsoft states that the code runs in isolated containers, has no access to your computer or the network, and that data is not persisted in the cloud. Read the page on data security and confirm it with whoever manages Microsoft 365 in your organization.
Limits
- It is a Microsoft 365 feature, not part of Excel as such. The plan, the channel and the platform decide whether you see PY at all.
- It needs the internet and uses a compute allowance. After the premium allowance is used, calculations run at standard speed.
- Python formulas do not run in Protected View. A workbook opened from the internet in Protected View will not run them.
- I ran the code in plain Python with pandas, not inside an Excel PY cell. The Excel formulas were recalculated in LibreOffice; tests 2 to 6 of the Check sheet need Microsoft 365 with Python in Excel, and you should confirm them there.
- Python is another tool, not a better one. Three of the five calculations are shorter or equal as formulas.
Workbook
Download the Python in Excel workbook, with fictitious data, no sign-up and no email. It has the five calculations with their Excel formula and the pandas result, the code for the five PY cells ready to copy, and seven guided tests. The file has no PY cells: you write them in Excel, which is the point of the exercise.
If you want a calculation moved from formulas to Python, or the other way around, in your own workbook, let's talk.